How to Boost Your Efficiency With An ABC Analysis

Managing your ecommerce inventory is not about stocking every product - it’s about stocking smart.
That’s where ABC analysis comes in. This time-tested strategy helps you stay profitable, streamline your operations, and focus your resources where they matter most. Instead of giving every SKU equal attention, it helps you double down on the ones that actually move the needle.
In this post, you’ll learn exactly what ABC analysis is, why it works so well for ecommerce businesses, and how you can implement it step-by-step, so you can make smarter inventory decisions without adding to your workload.
What Is ABC Analysis?
ABC analysis is a method of categorizing inventory based on its value to your business. It splits your stock into three groups:
A items: Your top performers. These typically make up about 10% of your total inventory but account for up to 70% of your sales. They deserve the closest attention.
B items: Reliable mid-range products. They often represent around 20% of sales and 20% of inventory. Not as critical as A items, but still important.
C items: These make up the majority of your SKUs but contribute the least to your revenue, often around 10%. They round out your offerings but require less oversight.
This approach is based on the Pareto Principle, also known as the 80/20 rule: roughly 20% of your products will drive 80% of your value. ABC analysis helps you act on that insight, so you can make better business decisions.
Why ABC Analysis Matters for Ecommerce Sellers
When you're managing hundreds, or thousands, of SKUs, it’s easy to get stuck treating them all the same. But not all products deserve the same level of attention.
Here’s how ABC analysis helps you work smarter:
Focus where it counts: Keep a close eye on A items so you never run out of your most valuable SKUs.
Use your space wisely: Avoid overstocking C items that take up shelf space without delivering returns.
Improve forecasting: Knowing which products drive the most value helps you plan better and budget smarter.
Cut waste: Spot slow movers early, reduce dead stock, and free up cash.
Stop treating all SKUs equally: Because they’re not.
ABC analysis gives you a smarter way to manage your inventory, and your time.
How to Conduct an ABC Analysis (Step-by-Step)
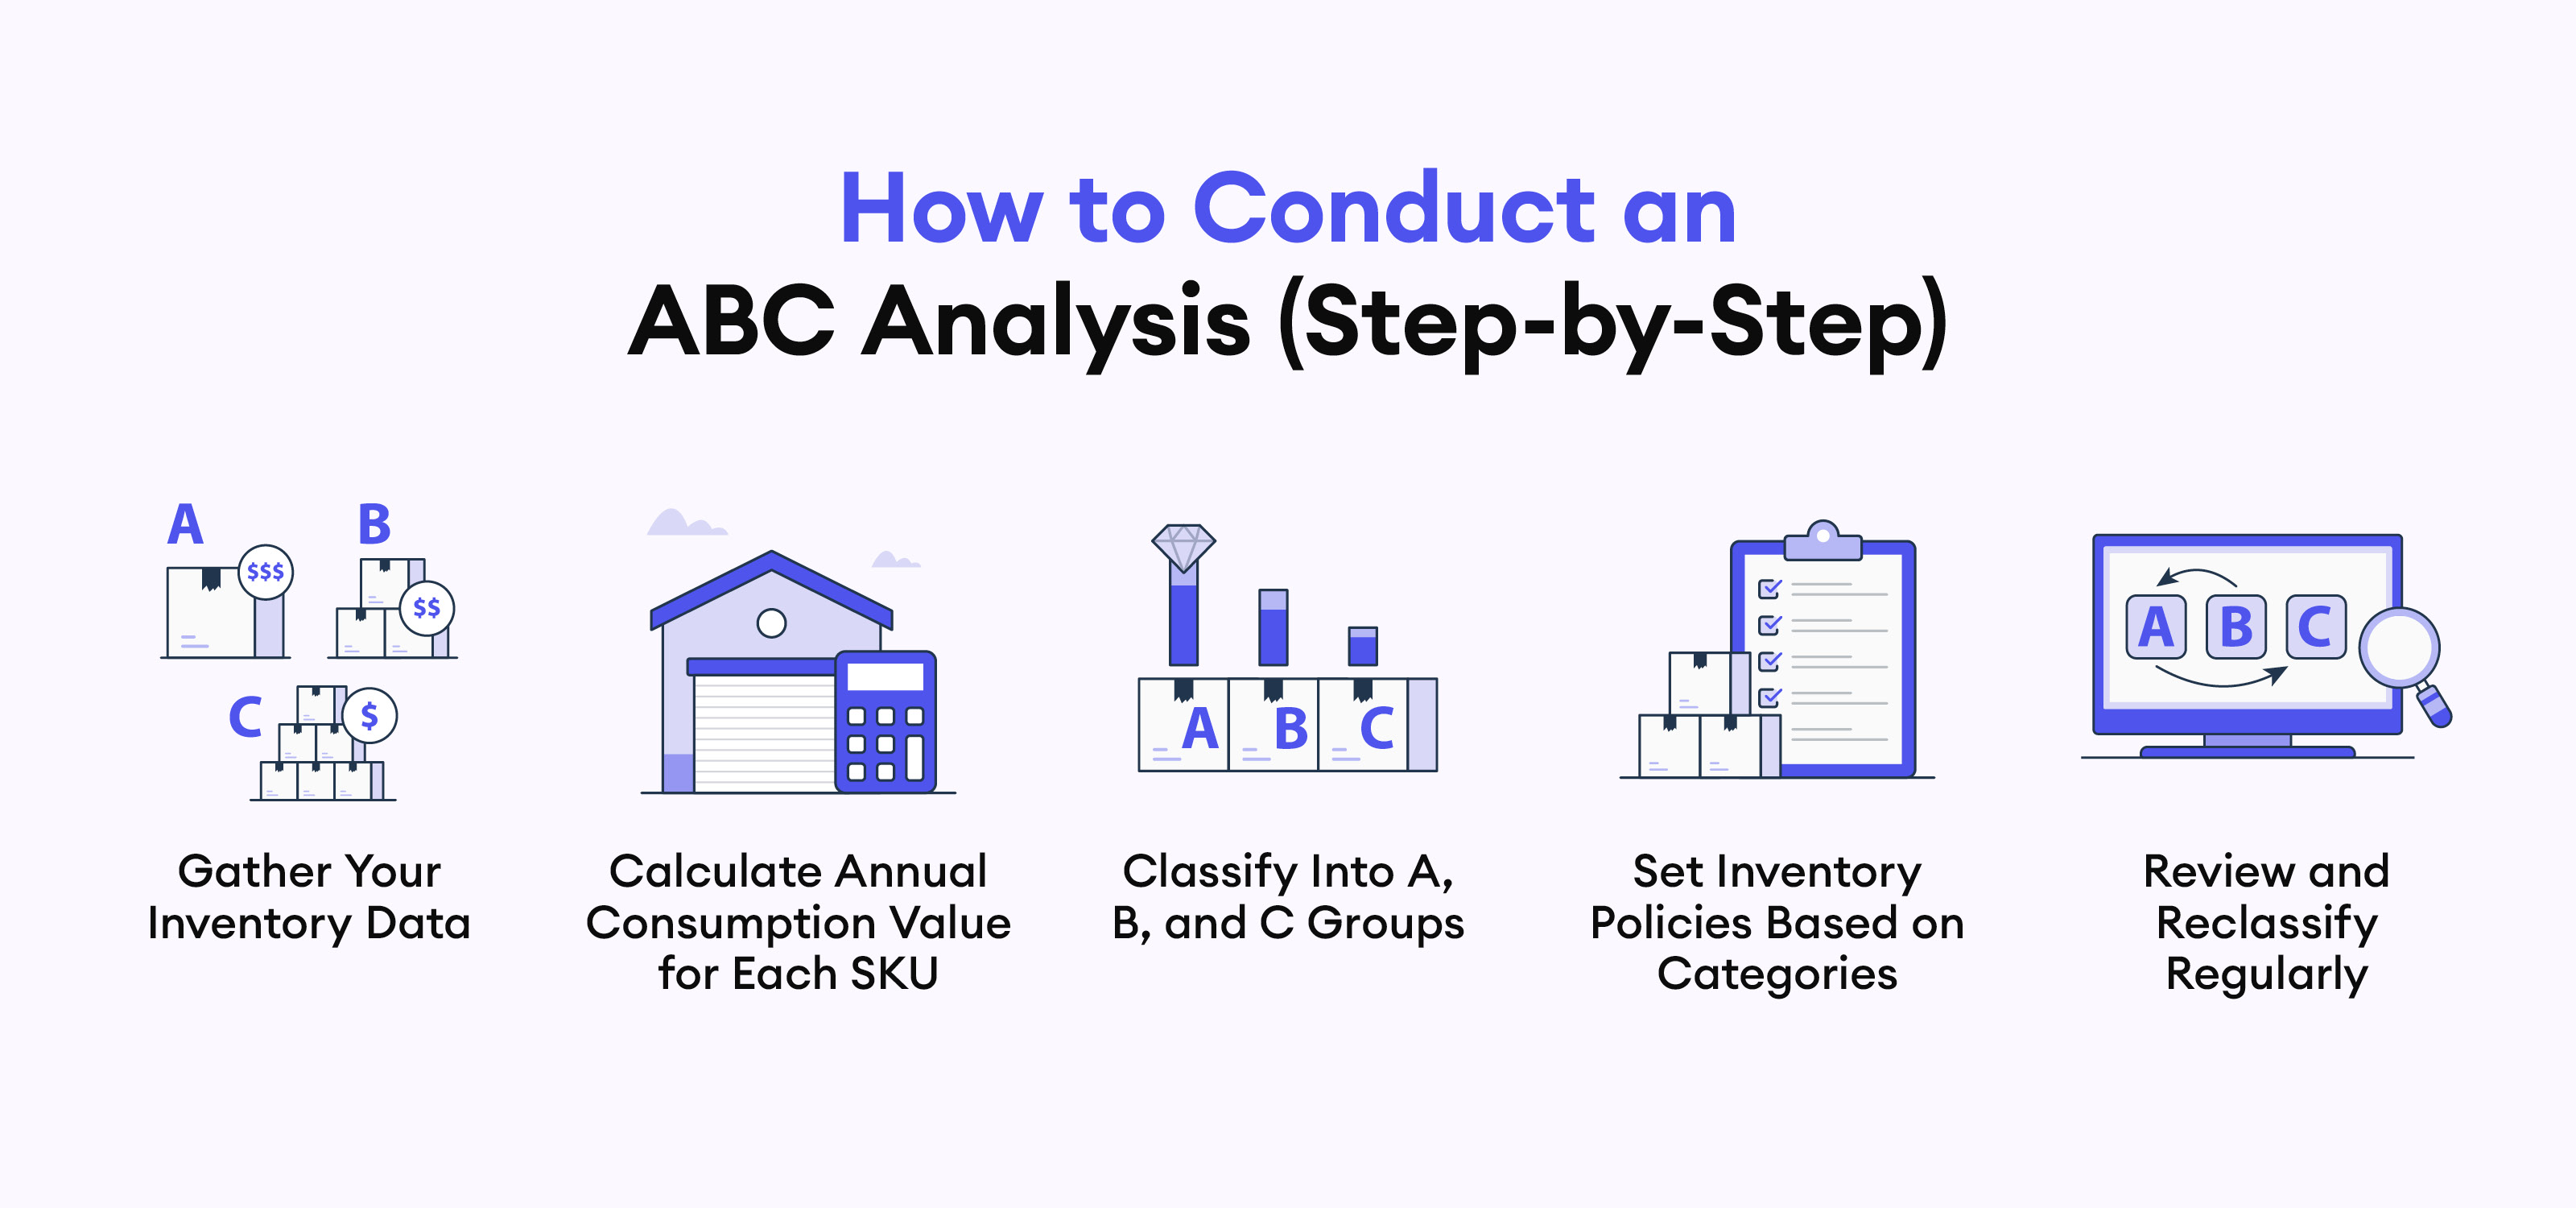
1. Gather Your Inventory Data
Start by pulling the right metrics for each SKU:
Sales volume
Revenue
Cost per unit
Order frequency
If you're using Goflow, good news, this information is already available in your dashboard. You can quickly export SKU-level data without needing to chase down reports from multiple systems.
2. Calculate Annual Consumption Value for Each SKU
Use this formula:
Annual demand × Item cost = Annual consumption value
Then:
Sort SKUs by total consumption value (highest to lowest)
Calculate cumulative percentages for both number of SKUs and total value
This gives you a clear picture of which products are pulling the most weight.
3. Classify Into A, B, and C Groups
Now that you’ve calculated the annual consumption value of all these items sold, the next step is to group your SKUs into A, B, and C categories. Here’s a common breakdown:
A items: Top 10–20% of SKUs generating 70–80% of value
B items: Next 30% generating 15–25%
C items: Remaining 50% contributing around 5%
These percentages aren’t set in stone. You can (and should) adjust them based on your business model and goals. For example, if your product catalog is seasonal, your classifications may shift more often.
4. Set Inventory Policies Based on Categories
Now that you’ve grouped your products, the next step is to set inventory policies so you can manage them accordingly. Here’s what those policies might look like:
A items: Monitor stock levels frequently. Forecast demand closely. These are your VIPs, don’t let them sell out.
B items: These stock items should be checked on regularly, but they don’t need daily attention.
C items: Use a light touch. Consider whether they’re worth restocking or if it’s time to liquidate slow movers.
This is where your operational strategy really starts to benefit, because you’re putting your energy where it matters.
5. Review and Reclassify Regularly
Inventory isn’t static. A bestseller today might be a shelf-sitter next quarter. This is especially true if you stock seasonal products, or if you’re in an industry where trends shift rapidly. Review and update your ABC categories quarterly (or more often if your catalog changes fast).
With Goflow, you can automate this re-analysis using real-time reporting tools. Goflow allows you to generate inventory reports to get a birds-eye view of all your inventory across all warehouses, so you can get powerful, on-demand insights into your entire business. That way, your inventory strategy stays aligned with your current business needs, not last year’s trends.
Work Smarter, Not Harder
Inventory management doesn’t have to be overwhelming. ABC analysis gives you a simple, strategic way to focus your attention where it matters most, and Goflow’s reports and analytics make it easier.
Taking the time to track the performance of your products and categorize them effectively ensures you’re always making decisions based on real data, rather than guesswork.
Want to see it in action? Book a Goflow demo today.